
The Average Patient Wait Times exercise is the #WOW22 Week 45 Tableau challenge created by Erica Hughes and it is available on the Workout Wednesday website.
If you’re serious about strengthening your Tableau skills, I recommend you partake in the weekly challenges available on the platform.
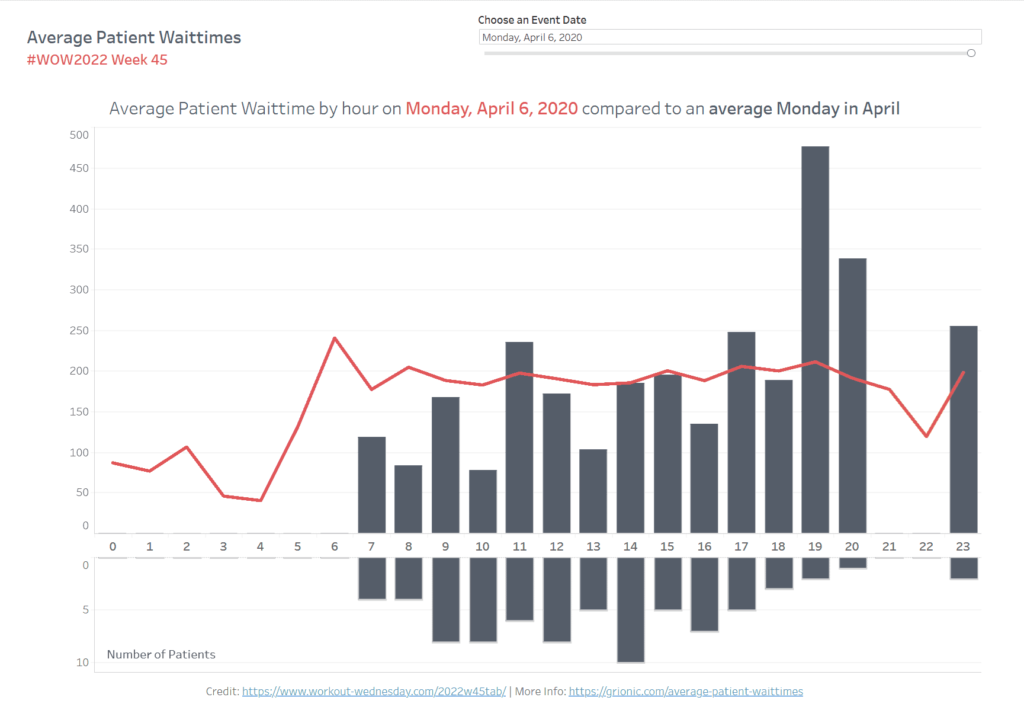
The goal of the WOW22 WEEK45 challenge is to be able to compare the wait time of a particular day with the average wait time of that weekday within that month.
Let me clarify.
Imagine you’re going to a restaurant for the first time this Sunday at 7 pm. However, on Sunday, there’s a highly publicized event in the same area where the restaurant is located.
So, you’d like to know. Will this event affect the restaurant wait time on Sunday between 7 pm and 8 pm?
The answer to this question can help you determine the best time to visit the restaurant.
This form of analysis is very useful in industries where there is seasonality. For example: travel, restaurants, hospitality, and healthcare.
Learning Outcome
Completing this challenge improved my knowledge about DateTimes and Table Calculations in Tableau.
Dataset
You can get the Average Patient Wait Times dataset on Data.World.
Requirements
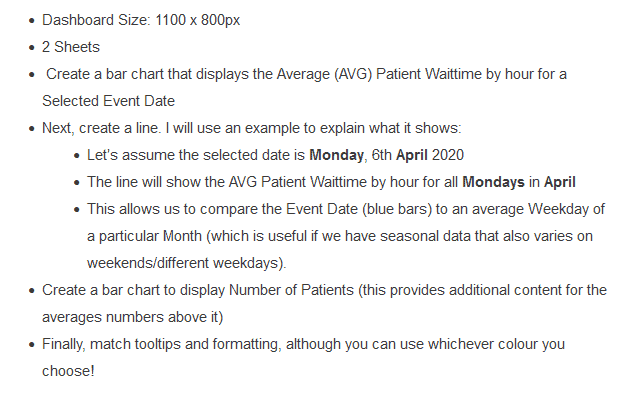
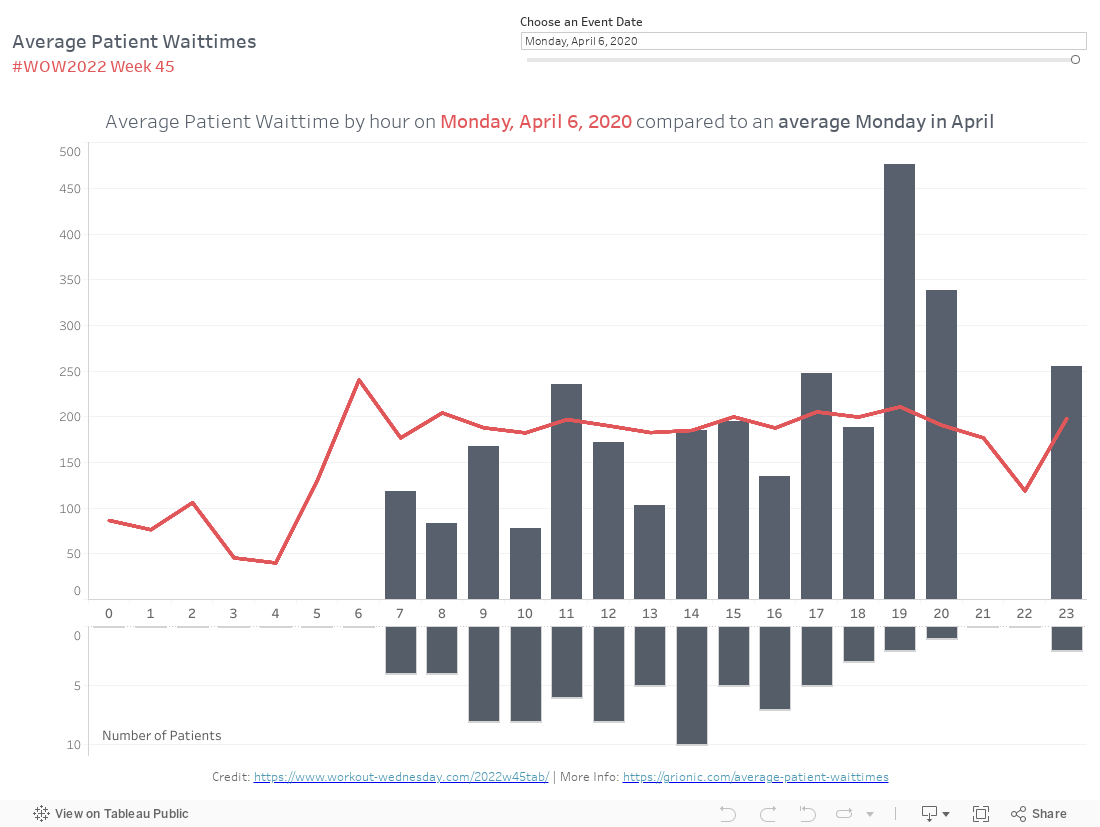
Result
Here’s my copy.
Happy Analyzing!